QLIQUID WINDOW documentation
Here we have some video review of QLIQUID WINDOW
Installing
Qlik sense desktop:
- 1. Navigate to ..\Users\UserName\Documents\Qlik\Sense\Extensions and create folder qlq-window
- 2. Сopy all files to new directory from zip file.
- 3. There should be one JavaScript file and one QEXT file
Qlik Enterprise:
- 1. Open Qlik Management Console.
- 2. Select Extensions on the QMC start page or from the Start Arrow down drop-down menu to display the overview.
- 3. Click Create new Import in the top right corner.
- 4. Select qlq-window.zip to import.
Qlik Cloud:
- 1. In the Management Console, go to the Extensions section and click Add in upper the right-hand corner.
- 2. In the pop-up, click Browse to select an extension file, or drop a file in the designated area.
- 3. Click Publish.
- 4. In the Management Console go to Content Security Policy. Add new one:
Name : as you want to name for ex. QLIQUID
Origin: qliquid.io
Allow: child-src, connect-src, object-src, scrtipt-src
How to update Qlik Sense Extension:
After download of new version just delete old extension and install new depending on your system. All data and settings will be saved.
Settings visualization
In QLIQUID WINDOW, you can embed two types of objects:
- 1. Charts from other applications
- 2. WEB pages
In this section of the documentation, we will discuss how to add visualization, and in the paragraph below, it is described how to add data from web pages.
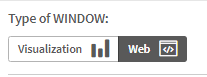
To add a chart, you need to select the "Visualization" option in the Type of Window parameter.
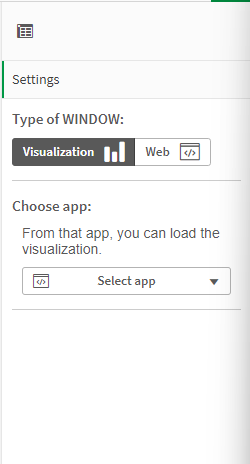
The extension will analyze the applications on the server, and you can choose one of them from the list.
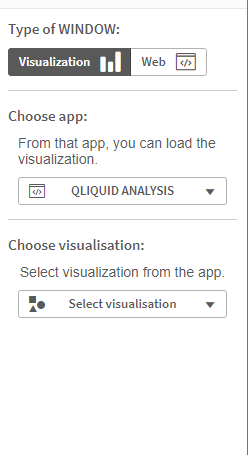
The next step is to select a master chart from the list of the application chosen above.
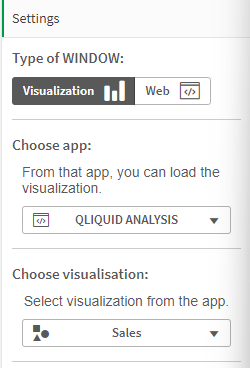
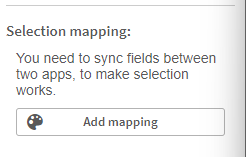
After selecting an application, this visualization will load and be displayed. However, selections do not apply to this visualization because these are two different applications and two different data models. To enable the filters work, you need to create a mapping. Where you will define which fields to pass as a selection, as well as their correspondence. To do this, click on the 'Add mapping' button.
Next, select the following options:
- 1. Field from the linked app"
- 2. Type of value - text field, numbers field, fixed value
- 3. Field from the current app or string value for fixed value type
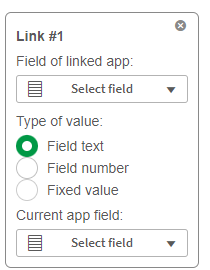
The selection will be transferred to the second application, and your visualization will be updated. Next, create mappings for common fields between applications that you want to use for the selection.
Settings - web
In addition to the ability to embed charts, you can also add data from web applications. To do this, specify "Web" in the Type of Window.
Next, choose the type of display:
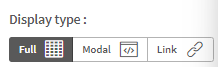
- 1. Full - the page will be displayed in full immediately
- 2. Modal - the page will be displayed in a modal window
- 3. Link - a button with a link will be displayed
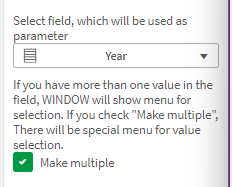
At the next step, create the parameters that you will insert into the URL for your page.
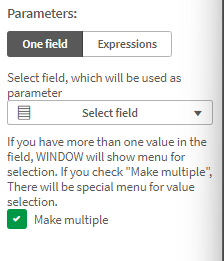
You can use two types of parameters simultaneously:
- 1. Field - it will simply take a single value from a field.
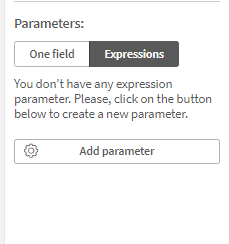
- 2. Expression - a calculated parameter based on a formula.
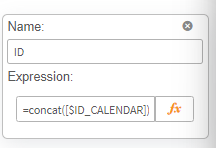
And also create a parameter based on a formula.
Let's name it "ID" and add a concat of fields separated by a comma
Next, you can use these parameters directly in the URL of the web source. Click on "Set URL".
Next, a modal window will open with the following settings:
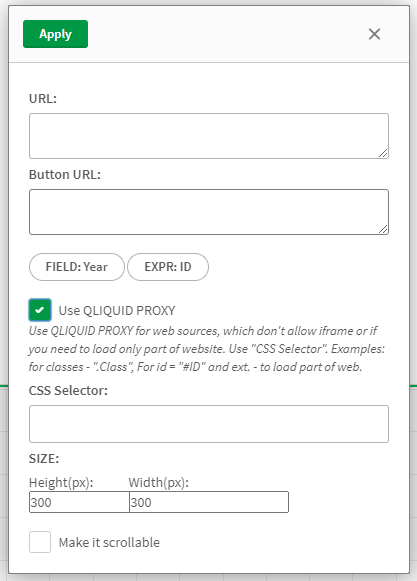
- 1. URL - The source URL from which the data will be retrieved.
- 2. Button URL - The URL that the user will be directed to when they click the button.
- 3. The parameters you set earlier. Click on one of them to add it in front of the cursor.
- 4. Use QLIQUID PROXY - Most web resources prohibit the use of iframes by third-party applications. Check this option to bypass this restriction.
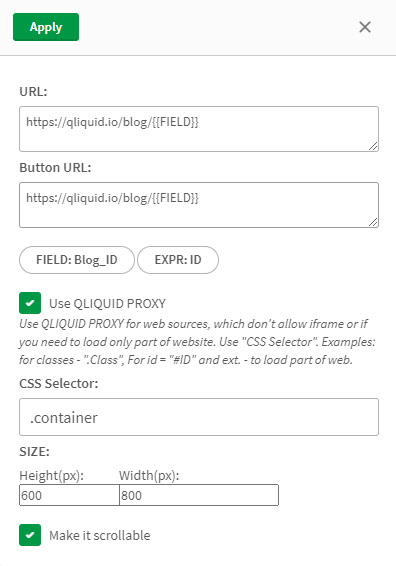
- 5. CSS selector - When using our proxy, you can load only a part of the site, not the whole. To do this, specify a CSS selector. For a full description of selectors, visit https://www.w3schools.com/cssref/css_selectors.php
- 6. SIZE - Specify the size of the window to be loaded.
- 7. Make it scrollable - Add scrolls when the size is exceeded.
Example for loading records by the BLOG_ID filter from our website.
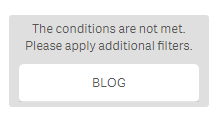
Condition
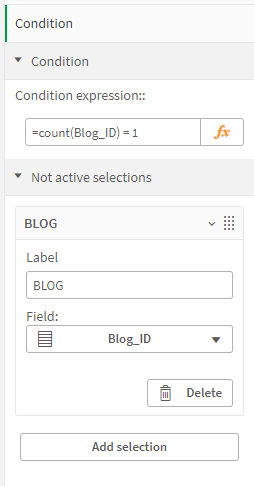
You can control the display of data using the Condition menu. Add a formula for the condition. Also, you can add filters that will be displayed when the condition is not met.
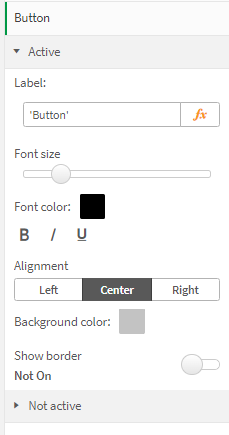
Button
For the display types "Modal" and "Link," you can add two types of styles: Active and Inactive.
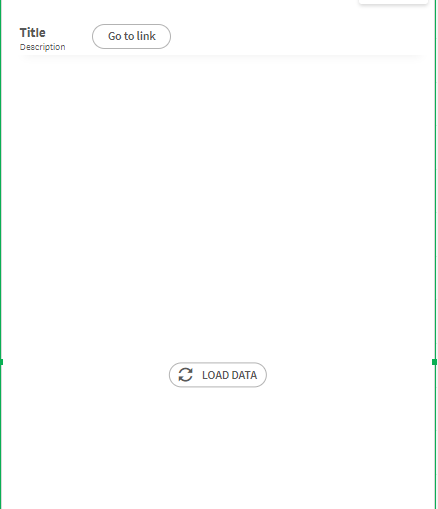
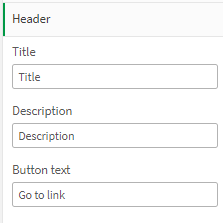
Header
You can adjust the labels and button text in the Header section.
LOAD
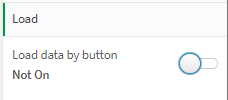
You can control the number of requests to the visualization or web resource using this switch. If it is turned off, requests will occur with each selection. If it is enabled, the loading will occur by pressing a button.