QLIQUID TABLE documentation
Settings
Installing
Qlik sense desktop:
- 1. Navigate to ..\Users\UserName\Documents\Qlik\Sense\Extensions and create folder qupp_table
- 2. Сopy all files to new directory from zip file.
- 3. There should be one JavaScript file and one QEXT file
Qlik Enterprise:
- 1. Open Qlik Management Console.
- 2. Select Extensions on the QMC start page or from the Start Arrow down drop-down menu to display the overview.
- 3. Click Create new Import in the top right corner.
- 4. Select qupp-table.zip to import.
Qlik Cloud:
- 1. In the Management Console, go to the Extensions section and click Add in upper the right-hand corner.
- 2. In the pop-up, click Browse to select an extension file, or drop a file in the designated area.
- 3. Click Publish.
- 4. In the Management Console go to Content Security Policy. Add new one:
Name : as you want to name for ex. QLIQUID
Origin: qliquid.io
Allow: child-src, connect-src, object-src, scrtipt-src
How to update Qlik Sense Extension:
After download of new version just delete old extension and install new depending on your system. All data and settings will be saved.
Dimensions
Use the "Dimensions" block to generate a list of available dimensions in the table. You can use the "Master" to quickly add dimensions from the master dimensions, fields and visualizations. Also you can create "Dimension groups" from added dimensions.
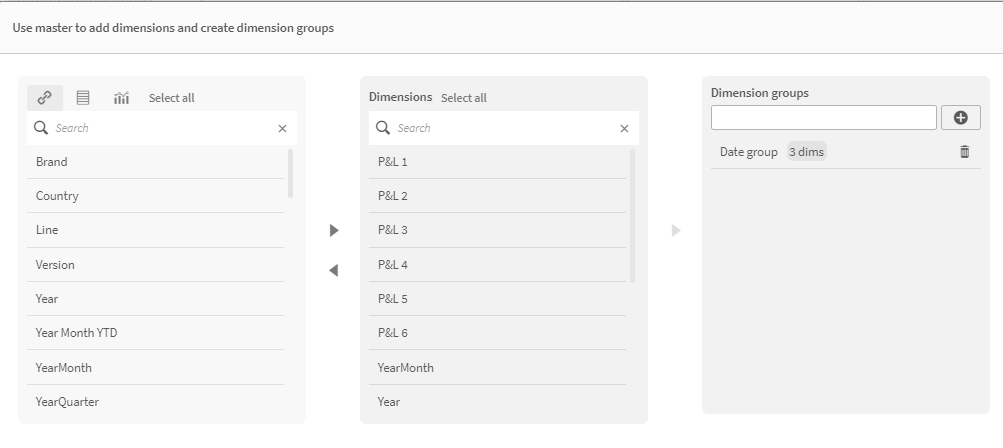
Dimension groups
Form dimension groups for easy management of hierarchical and related data.
You can create a dimension group in the corresponding tab or in dimension master. You can access dimension which you added in dimension tab.
Measures
Use the "Measures" tab to generate a list of available measures in the table. You can use the "Master" to quickly add measures from the master measures and visualizations. Also you can create "Measures groups" from added measures.
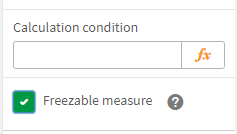
Measure have the following settings:
1. Calculation condition to show measure dynamically
2. Freezable measures - allow to lock selection for measure.
For settings add as first set expression "QLIQUIDSET" to set analysis of measure.
Make it freezable by checkbox in measure settings
 Freeze measure by clicking lock button on the measure.
Measure groups
You can combine measures into groups for easy management of additional visualization options.
 There is a global option "Show option name". This option controls the display of the name of the group in the table header. Also you can control style of each group.
Rows and columns
Use the Rows and columns tab to add dimensions and measures and their groups to the appropriate parts of the table. You can also create a table using Drag&Drop
Data views
Create data views with added dimensions. Click on "Add data view" and add dimensions from the list. You can't use dimension groups here.
Row style
In qliquid table you can style each row by value. At first step create new style in "Rows styles list". You can set font styles, background color, borders, show expand bottom or not, override column settings and indent in px.
 After creation of style you need to map style to the value in row. There are two options in "Row style mapping":
 - 1. By value manually. Just open the menu and choose appropriate value for style.
- 2. By dual value in a field. QLIQUID check last 2 digit of the field. And map it by the order in the "Row styles list".
Let's create example table in Qlik:
EXAMPLE:
LOAD
	dual(Line,Style) as Line,
Sum
INLINE [
  Line, Style, Sum
  Revenue, 0, 50
  Margin, 1, 60
  EBITDA, 2, 70
];
Header style
It's possible to set separate style of table's header. Font and background color can be changed.
Column stripe
This functionality allows you to style the dimensions in a column in order. You can highlight columns with color and borders.
Row hover
Use switch to turn on row hover and color-picker to choose color for hover effect.
Alignment
In this tab you can control the positioning of the text and the height of the row.
Usage
Report settings
The main interaction with the table happens with the help of dran&drop. Drag and drop dimensions and measures and generate the report you need.
Double click to delete dimension or measure. Also to delete all objects just double click on "Rows" , "Columns" text or measure icon.
Totals
To set total in column or in row just click on total button in the dimension.
Sorting
The table has the ability to quickly sort certain dimensions. To do this, click on the indicator, select the desired dimensions and the sorting direction.
Fast expand
Use the menu to expand rows or columns quickly. Select the level of expand using the buttons.
Insight menu
For quick calculations and comparisons of data with each other, you can use the "Insight menu". There are two options:
- 1. With one measure there is a comparison within the dimension in the column. You can compare columns one by one, with the first or with the last column. Also it's possible to show min or max value in dimension.
- 2. With multiple indicators there is a comparison between indicators. You can select measures to compare and type of comparison.
Excel
To import table to excel just click on the excel button. It saves the style and also shows the selection was made.
Sizing
You can change the size of the columns using special lines in the table header.
Data views
Click on measure-cell to open data-view menu.You can select all dimensions values using "Select data". Below select data you can click on created data-view to see data in other aggregation in modal table.