QLIQUID BAR
Data-driven bar chart for Qlik Sense.


DATA MENU
Control bar chart super easy.
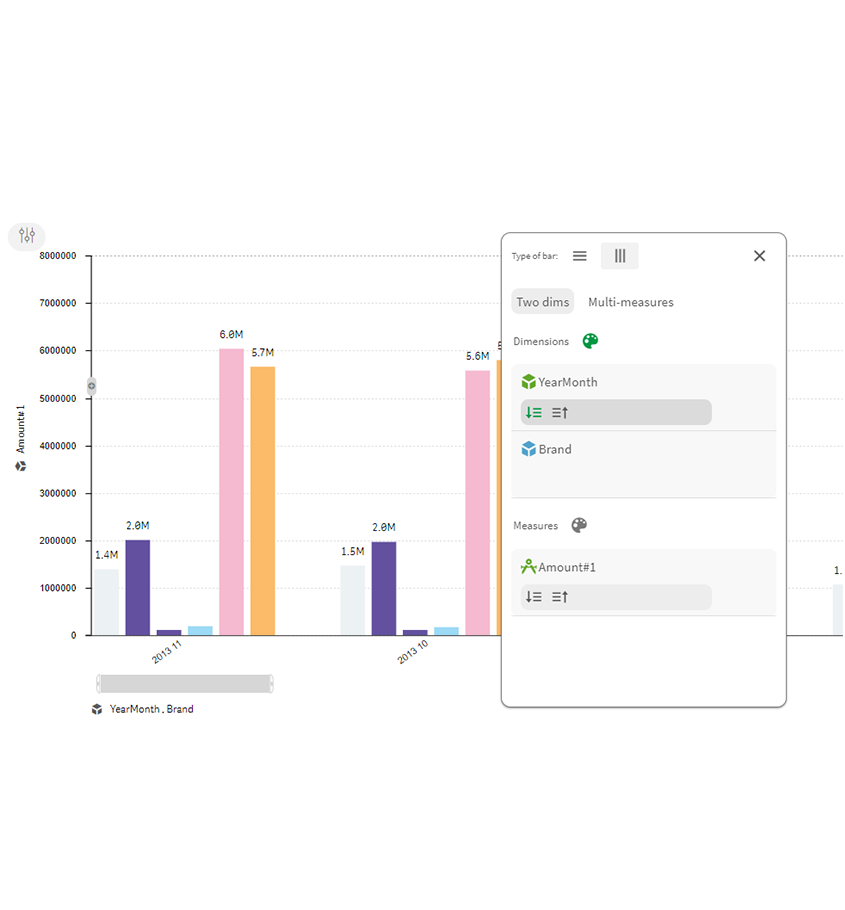
 Type of barChange from stacked to grouped chart.
  Dimensions and measuresSet data from the available list
  Sorting and colorsSort dimension by the measure on the fly.
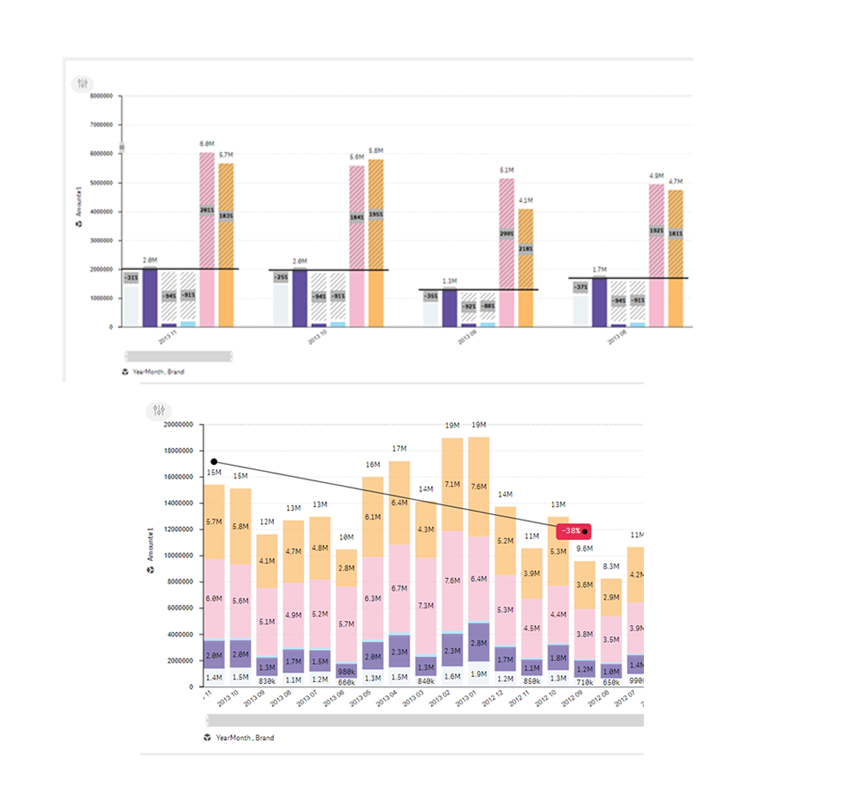
DATA COMPARE
Compare bars easily to each other.
Analyze difference in stacked and grouped chart.
- You can quickly grasp the data differences by selecting the bar to view the corresponding numbers.
- There is no need to use a calculator or Excel anymore.
- Show or hide compare functionality in main menu of the bar.
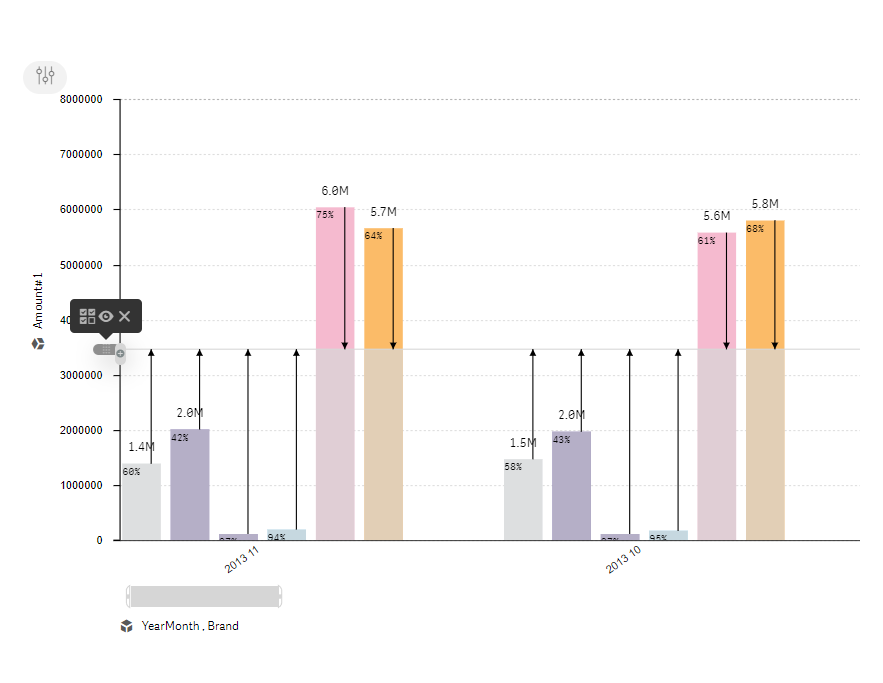
Reference lines
New life of reference lines.
Empowering users to tailor reference lines directly, ensuring a personalized analysis experience. Utilize color overlays and directional arrows for an intuitive understanding of data. Effortlessly filter and focus on data points that fall below a set reference value for targeted insights.